Monday, July 27, 2020

Portfolio Update Jul 20


Portfolio $633k (excluding SRS investment) consist of 59% cash & 41% shares.

Plan to further reduce cash ratio to 50%.

July Transactions
Invest Gilead 290 @ $73.64 avg price.
Divest Pfizer 100 @ $38.50, 15.1% realised gain.


Thursday, July 23, 2020

Pharma - Roche Q2'20 Earning

2020 Guidance
Group sales growth: Low to mid single digit.
EPS growth: Broadly in line with sales growth

Half Year 2020
Pharmaceuticals division contributes 79% of total sales.

                 * CER = Constant Exchange Rate


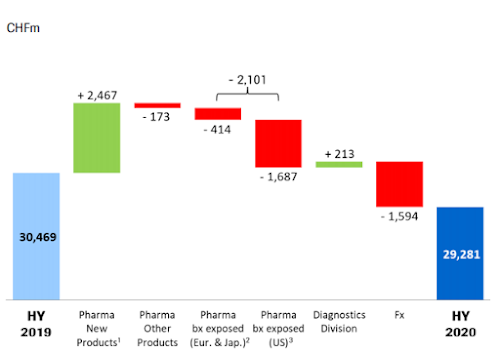
Half year sales decrease vs HY 2019 mainly due to biosimilar impact - CHF1.7b and unfav forex -CHF1.6b, offset by new products launch +CHF2.5b.


Sales by country/ regions:


Operating margin remained strong 40.2 % of sales.


Wednesday, July 22, 2020

Pharma - Novartis Q2'20 Earning

2020 Full Year Guidance
Sales expected to grow mid single digit.
Core operating income expected to grow low double digit

Q2 2020
Q2 2020 sales $11.3mil (- 4%) and Operating earning $2.4mil (-12%).

Excluding unfav exchange impact, Q2 2020 sales -1% vs PY & operating earning -4%.

Innovative Medicines net sales were USD 9.2 billion (-1%, +1% cc). 
Pharmaceuticals BU sales grew 1% (cc), as the launch uptake of Zolgensma and continuing momentum on Entresto and Cosentyx were mostly offset by the negative impact of the COVID-19 pandemic, particularly in ophthalmology and new patient starts in dermatology. 

Oncology BU grew 1% (cc) as the continuing momentum on Promacta/Revolade, Kymriah, Kisqali and Tafinlar + Mekinist as well as the launch uptake of Piqray was mostly offset by generic competition for Afinitor and Exjade and the negative impact of the COVID-19 pandemic, particularly in radioligand therapy. Generic competition had a negative impact of 4 percentage points, mainly driven by Afinitor, Exjade and Travatan, and net pricing had a negative impact of 4 percentage points. Volume contributed 9 percentage points to sales growth. 

Sandoz net sales were USD 2.2 billion (-11%, -9% cc) as volume declined 9 percentage points (cc) and pricing was in line with prior year, benefiting from favorable revenue deduction adjustments. The sales decline was due to COVID-19 negative impacts, mainly the reversal of Q1 forward purchasing and lower retail demand, some contract discontinuations in the US and a higher prior year base that included several first to market launches. The decline was partly offset by global sales of biopharmaceuticals growing 19% (cc), driven by double digit growth in Europe and the US.
 
1st Half 2020
1st half sales growing 6%, driving core operating earning and EPS growth of 19%.
Sales growth was mainly driven by Zolgensma and Cosentyx.
Core operating earning growth was driven by the higher sales and productivity, partly offset by some launch investments.


Novartis top 3 Innovative Medicines products in 2020:

Friday, July 17, 2020

Pharma - J&J Q2'20 Earning

Full Year Guidance
Full year operational sales guidance is $81 billion to $82.5 billion, or minus 1.3% to a positive 0.5%.

Adjusted earnings per share guidance ranging from $7.75 to $7.95, a range of minus 10.7% to minus 8.4%.

J&J anticipates strong EPS growth in 2021 on an operational basis given some of the dynamics at play in 2020.

Q2'20 Performance
Worldwide sales were $18.3 billion for the second quarter of 2020, a decrease of 10.8% versus the second quarter of 2019.

Net earnings were $3.6 billion and diluted earnings per share was $1.36 versus diluted earnings per share of $2.08 a year ago.

Revenue segment
1. Worldwide pharmaceutical sales of $10.8 billion grew 3.9%. Sales grew in the US by 5.8% and outside the US by 1.4%. 

2. Worldwide consumer health sales totaled $3.3 billion, declining 3.6%, with operational growth in the US of 1.3% and a decline outside the US of 7.4%. Growth was negatively impacted by COVID-19, driven by delayed diagnosis and slower new patient starts due to office closures and access to physician-administered drugs as well as the phasing impact of stocking in the first quarter.

3. Worldwide medical devices sales were $4.3 billion, declining by 32.7% due to the negative impact of COVID-19 restricting elective procedures across all regions. Sales declined in the US by 39.6% and declined 26.4% outside the US Given the negative impact of COVID-19 across all platforms,

Pharmaceutical Details
1. Oncology
Oncology portfolio delivered another strong quarter with worldwide growth of 5.7%.

DARZALEX continued its strong performance, growing 18.8% globally.

IMBRUVICA grew 17% globally, driven largely by market share gains and strong market growth.

IMBRUVICA growth year to date is strong at over 25% as IMBRUVICA remains the best-in-class BTK inhibitor and is the new and total patient share leader in CLL line one, CLL line two-plus, and MCL line two-plus. 

2. Immunology

Year to date, immunology growth is 7.9% worldwide and US growth is 5.1%. 

STELARA growth of about 10% was driven by continued share gains in Crohn's disease with about a seven-point share increase in the US and growth from the recently approved ulcerative colitis indication. 

On a year-to-date basis, STELARA growth remains strong at about 20% globally. 

TREMFYA, the first-in-class market-leading IL-23 inhibitor therapy, grew 46% globally and achieved roughly a 10% share of the psoriasis market in the US, which is up about three points from the second quarter of 2019. Sales growth was partially offset by continued erosion of REMICADE of about 14% from share loss due to alternative mechanisms of action and biosimilars.


3. Neuroscience 
Paliperidone long-acting portfolio performed well, growing almost 9%, led by double-digit US growth of 13.8% due to market growth in the US, along with share gains for INVEGA SUSTENNA and INVEGA TRINZA. 

Monday, July 13, 2020

Net Worth Growth - from Zero to Million

How long it required for an average employee to achieve $1 Million net worth? 

It took me 13 years to grow my net worth from zero (or negative if take into consideration of study loan) to $1 Million.

This is not impressive and I missed my personal goal - achieve $1 Million in 10 years. However, I still feel glad that I have finally achieved it! (better late than never)

Referring to my monthly net worth tracking, below is the breakdown of time required to accumulate $100k.

First $100k   : 6.2 years 
2nd $100k    : 13 mths
3rd $100k    : 9 mths
4th $100k    : 11 mths
5th $100k    : 13 mths
6th $100k    : 7 mths
7th $100k    : 8 mths
8th $100k    : 7 mths
9th $100k    : 8 mths
10th $100k  : 9 mths

What surprised me the most is it took me close to 50% of 13 years to reach 1st $100k net worth, before I manage to accelerate my net worth growth from year 7 onward.

Looking back my historical records, few main elements which support the growth:

1. Increase in salary 
    
2. Slower increase in spending vs salary 
    I do see my saving: income ratio increases from 10% when I start work to > 50% as of today.

3. Dividend income

This is my first milestone toward FIRE! 

I hope 2nd milestone will take < 8 years.